HP Divergence Estimation Tutorial#
Problem Statement#
When evaluating new testing data, or comparing two datasets, we often want to have a quantitative way of comparing and evaluating shifts in covariates. HP divergence is a nonparametric divergence metric which gives the distance between two datasets. A divergence of 0 means that the two datasets are approximately identically distributed. A divergence of 1 means the two datasets are completely separable.
When to use#
The Divergence class should be used when you would like to know how far two datasets are diverged for one another. For example, if you would like to measure operational drift.
What you will need#
A set of image embeddings for each dataset (usually obtained with an AutoEncoder)
A python environment with the following packages installed:
tensorflow-datasetspytest
Setting up#
Let’s import the required libraries needed to set up a minimal working example
import numpy as np
import tensorflow_datasets as tfds

from dataeval.metrics.estimators import divergence
Loading in data#
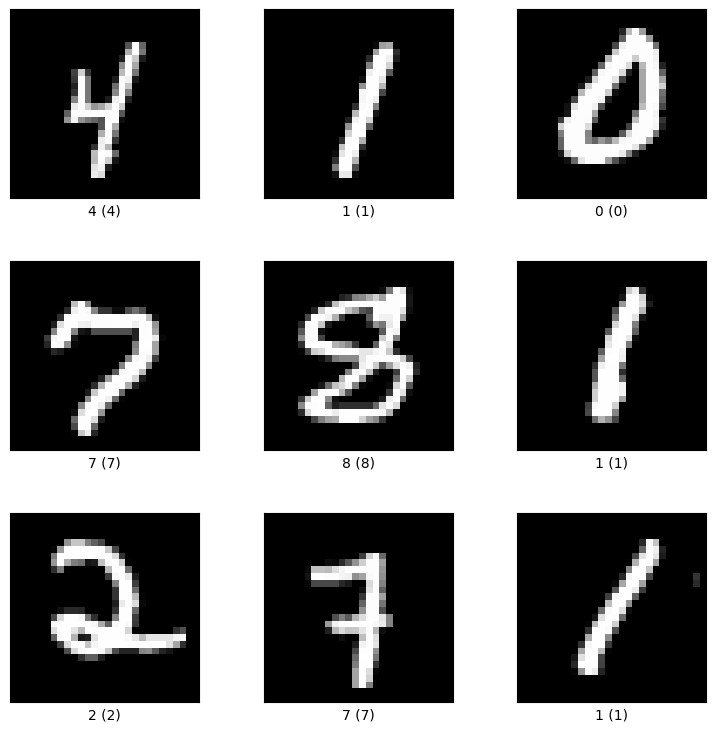
Let’s start by loading in tensorflow’s MNIST dataset, then we will examine it.
# Load in the mnist dataset from tensorflow datasets
images, ds_info = tfds.load(
    "mnist",
    split="train[:4000]",
    with_info=True,
)
tfds.visualization.show_examples(images, ds_info)
images = images.shuffle(images.cardinality())
images = np.array([i["image"] for i in images])
print("Number of samples: ", len(images))
print("Image shape:", images[0].shape)
Number of samples:  4000
Image shape: (28, 28, 1)
Calculate initial divergence#
Let’s calculate the divergence between the first 2500 images and the second 2500 images from this sample.
data_a = images[0:2000].reshape((2000, -1))
data_b = images[2000:].reshape((2000, -1))
div = divergence(data_a, data_b)
print(div)
DivergenceOutput(divergence=0.0, errors=2009.0)
We estimate that the divergence between these (identically distributed) images sets is at or close to 0.
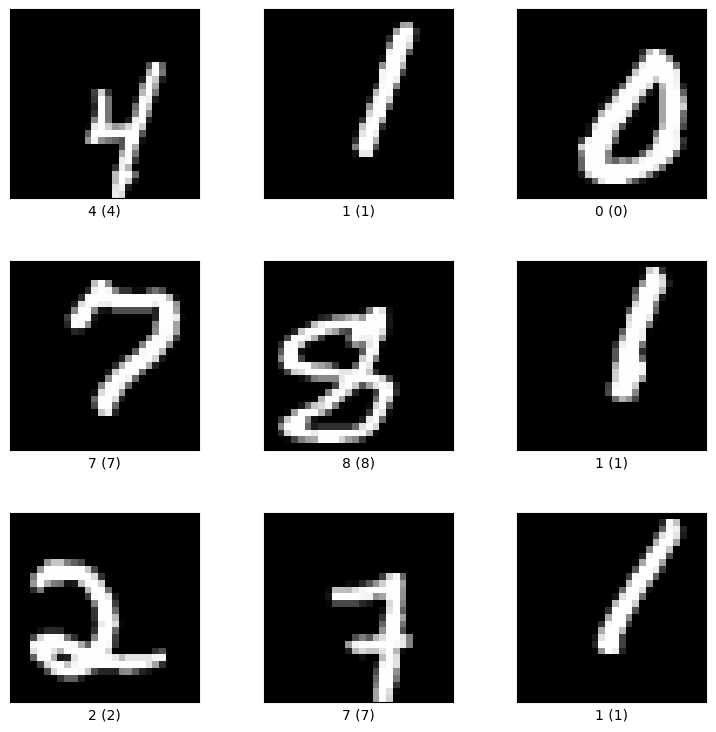
Loading in corrupted data#
Now let’s load in a corrupted mnist dataset.
corrupted, ds_info = tfds.load(
    "mnist_corrupted/translate",
    split="train[:2000]",
    with_info=True,
)
tfds.visualization.show_examples(corrupted, ds_info)
corrupted = corrupted.shuffle(corrupted.cardinality())
corrupted = np.array([i["image"] for i in corrupted])
print("Number of corrupted samples: ", len(corrupted))
print("Corrupted image shape:", corrupted[0].shape)
Number of corrupted samples:  2000
Corrupted image shape: (28, 28, 1)
Calculate corrupted divergence#
Now lets calculate the Divergence between this corrupted dataset and the original images
data_corrupted = corrupted.reshape((2000, -1))
div = divergence(data_a, data_corrupted)
print(div)
DivergenceOutput(divergence=0.9635, errors=73.0)
We conclude that the translated MNIST images are significantly different from the original images.