Testing and evaluation engineer workflow
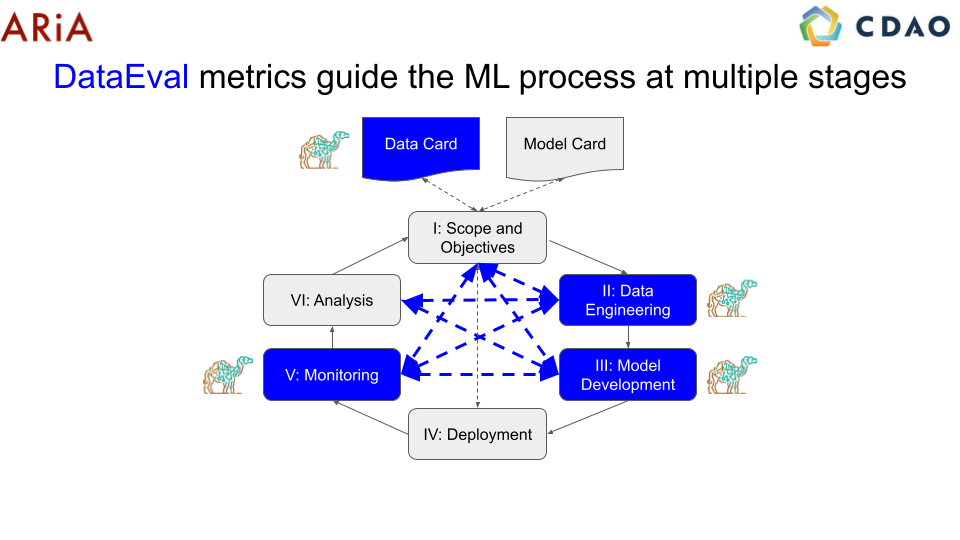
In this workflow, we will describe how a testing and evaluation (T&E) engineer can use DataEval, and which components of our toolkit are suitable for their use. The T&E engineer interacts with DataEval at both the data engineering, and monitoring stages of the AI/ML lifecycle.
Data engineering
First, in the data engineering stage, T&E engineers assess the quality of the data for the desired task. For example, if a higher percentage of image are difficult to classify, and the operational requirements are high, the problem may need to be reformulated or reposed, or additional data will need to be collected. The diagnostic part of this stage is sometimes called exploratory data analysis (EDA). The T&E engineer can make decisions with respect to problem feasibility or data hygiene following EDA.
T&E Engineers can first analyze raw datasets through the linting feature.
This tool will identifyimages which are too dark, too blurry, etc. The T&E Engineer can then decide if these images are acceptable as is, or ought to be edited/removed from the dataset. The point of dataset linting is to identify qualitative patterns in the image data that may impact model training downstream. In cases where substantial issues exist in some images, they can be filtered out or adjusted in some way. An example output of linting can be seen below:
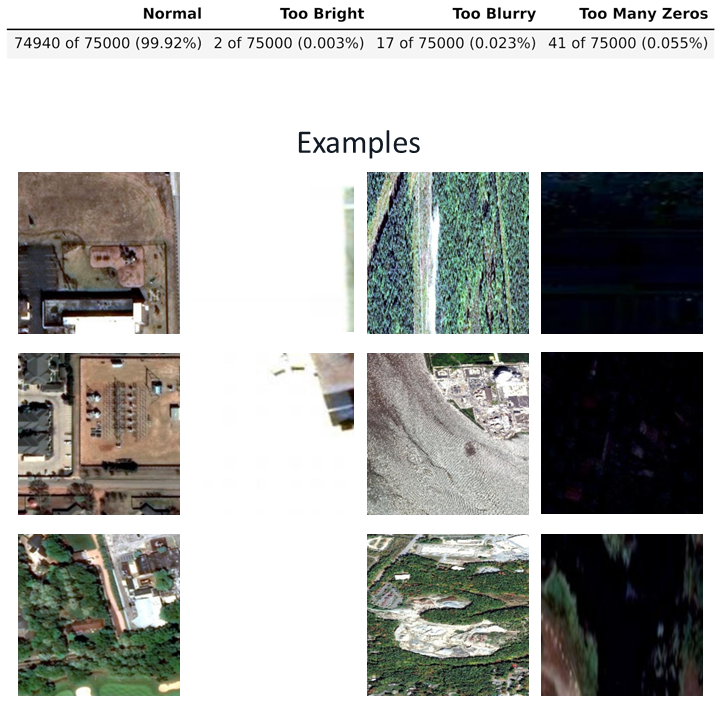
In this case, some of the bright and dark images in particular are nearly unusable, and would be very difficult for even a knowledgeable human to identify. Other quality extremes are less problematic.
Following basic dataset linting and analysis of the images themselves, T&E engineers can perform metadata analyses, checking if certain metadata factors are imbalanced or are associated with label. They can do this via the classwise balance and diversity features. The former checks if individual class labels and image metadata factors have strong mutual information a measure of the association. The latter measures if there is sufficient metadata spread within each class label distribution.
Both of these metrics tell the T&E engineer if there are potentially problematic interaction between image metadata and label. High or low values for these metrics could imply systemic undersampling in certain image subcategories. In such cases, a T&E engineer may want to upsample or downsample certain image classes or metadata factors to maintain Balance. Examples outputs for these metrics can be seen below:
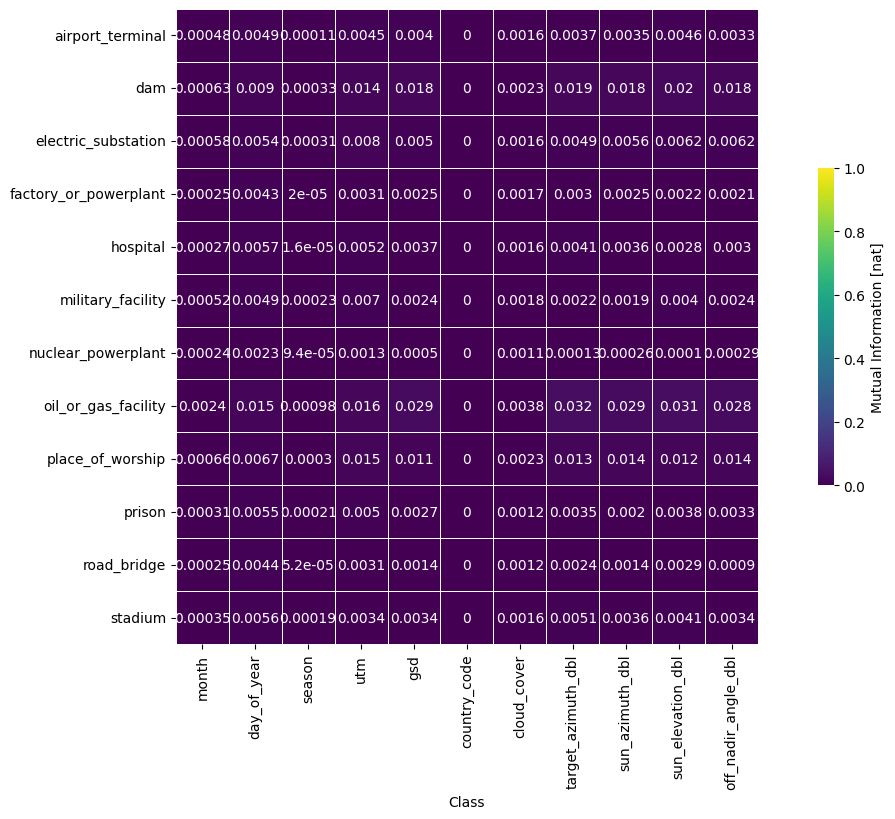
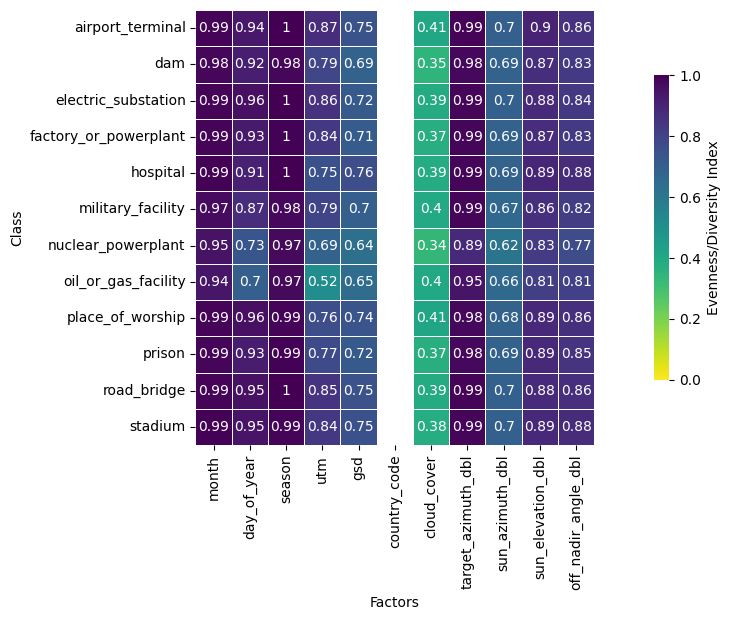
In this particular case, there seems to be quite low diversity in cloud coverage, but this pattern is repeated across all classes. This tells the T&E engineer that perhaps some data preprocessing has been done with respect to this metadata factor.
Following these and potentially other analyses, the T&E Engineer passes off the dataset for corresponding model development.
Monitoring
As a T&E engineer, one is also responsible for monitoring deployed models. The purpose of the monitoring stage is to ensure that the data the model is being applied to resemble those on which the model was trained. It is not necessary for these data to be identically distributed, merely that differences between training and operational data will not affect performance. Detection of dataset drift or anomalous images can indicate to the T&E engineer that additional training, or complete retraining, will need to occur in order for the model to perform similarly to test set performance.
There are several tools an engineer can leverage to analyze and evaluate the performance of a deployed model, and potential changes in operational data. The first of these tools is coverage. coverage tells the T&E engineer which images in the operational set have few other images which are similar to it. Such images can tell a T&E engineer which image factors may be undersampled in operational data. This is critical as regions of the image space that were densely sampled in the training data, and therefore fit quite accurately, may not correspond to regions that are densely sampled in the operational dataset. Such a difference can lead to performance degradation even if the operational environment itself has not changed. An example of a coverage output can be seen below:
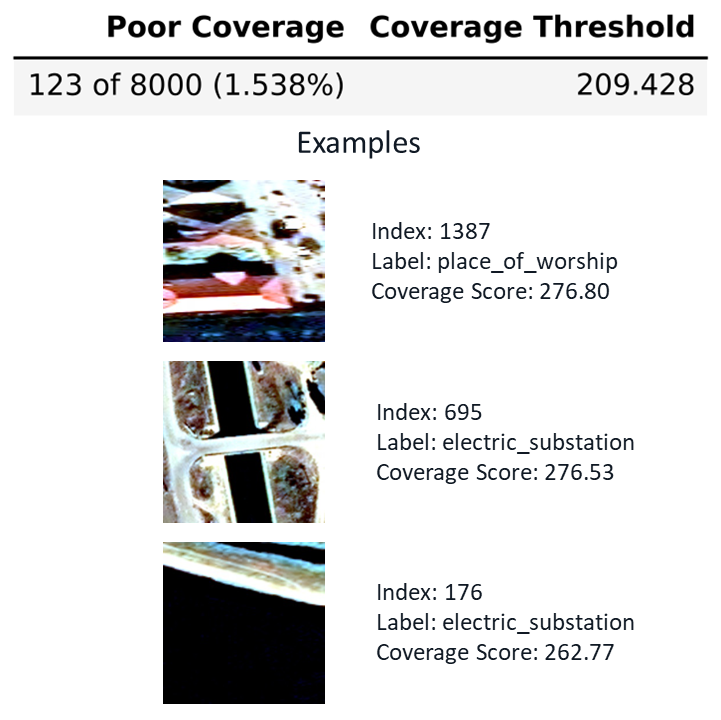
In this example, the T&E engineer was able to identify high-contrast electric substations as a potentially problematic subclass in the operational dataset.
Another image assessment tool is out of distribution (OOD) detection. This tool detects images which look entirely dissimilar to those on which the model was trained. Such images can indicate to a T&E engineer that there has been a qualitative shift in image distribution, or that a new, operationally relevant class has emerged. An example OOD output can be seen below:
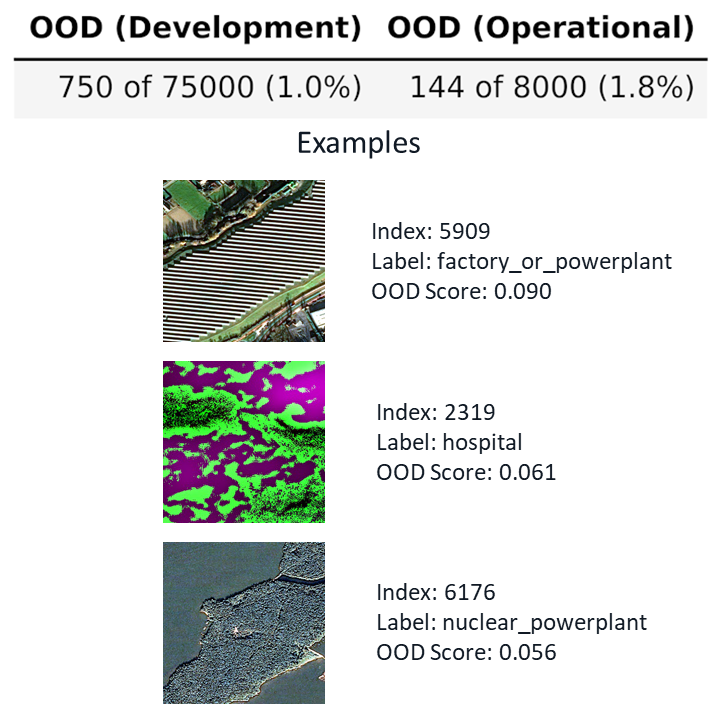
Here, we can see that a new type of powerplant, a solar farm, has emerged in the operational dataset. This type of powerplant was not present in the training set, and is therefore flagged as out of distribution. This would constitute a retraining event for the T&E engineer.
Finally, the T&E engineer can look at overall dataset drift. Dataeval has several tests which determine if the operational dataset is significantly different from the training data. Such changes are known to be associated with performance degradation, so the T&E engineer would trigger retraining as a result of significant drift. An example output can be seen below:
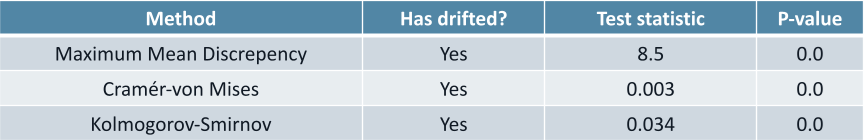
These results indicate that the operational set has shifted substantially, a result confirmed but some of the analyses above. Such indications should tell the T&E engineer that the model should be retrained.
With all of these tools in DataEval, a T&E engineer can conduct analyses at multiple stages of the AI/ML lifecycle.